MUNICIPAL SOLID WASTE: HOW TO REDUCE IT BY 2050
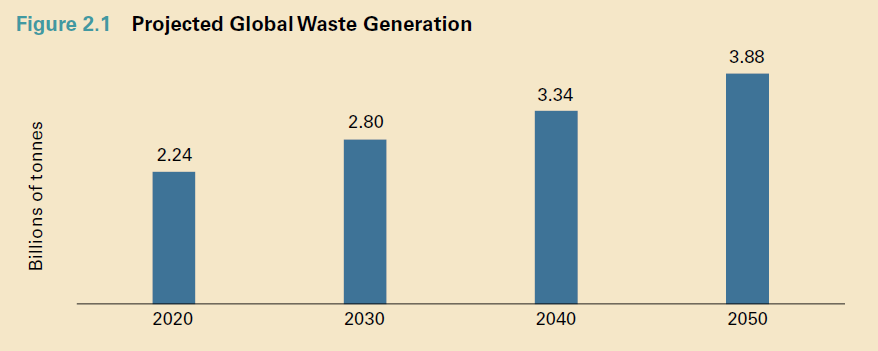
The recent publication More Growth, Less Garbage (1) updates the data of the study What a Waste 2.0: A Global Snapshot of Solid Waste Management to 2050 (2), developed by the World Bank, which globally aggregates municipal solid waste national data, reporting estimated generation to 2050. Global waste generation is estimated to grow from 2.24 billion tonnes in 2020 to 3.88 billion tonnes in 2050. In addition to basic waste data metrics, the reports provide information on costs, revenues and tariffs, as well as an analysis of case studies for production diversification.
Last year’s numbers
Based on the data collected for previous years, the publication estimates that in 2020, the world generated 0.79 kg of waste per capita every day, with volumes generally correlated to income levels and variable between regions, with an overall estimate of 2.24 billion tonnes of municipal solid waste at global level.
Source (1)
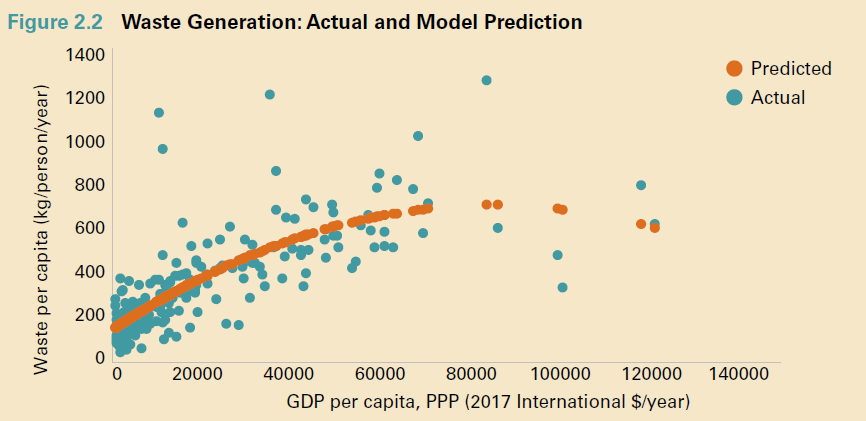
Waste generation is strongly correlated to per-capita GDP.
Source (1)
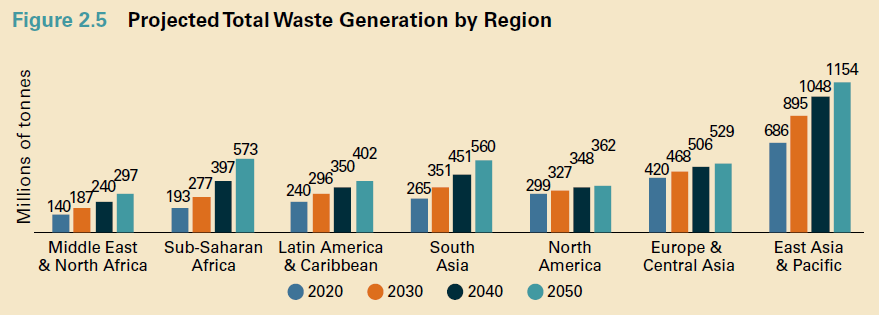
Differences at regional level
It is estimated that in 2020, high-income countries generated average waste of 1.60 kg per person per day, compared with 0.91 kg per person per day for upper-middle-income countries and 0.47 kg per person per day for lower-middle-income countries.
Finally, low-income countries generate only 0.41 kg of waste per person per day. Rising incomes have led to increased waste generation. Decoupling the two indicators, encouraging virtuous behaviour and promoting methods that reduce or limit the amount of waste generated in growing economies will be crucial in the next few years. Regional data partly reflect income disparities.
Source (1)
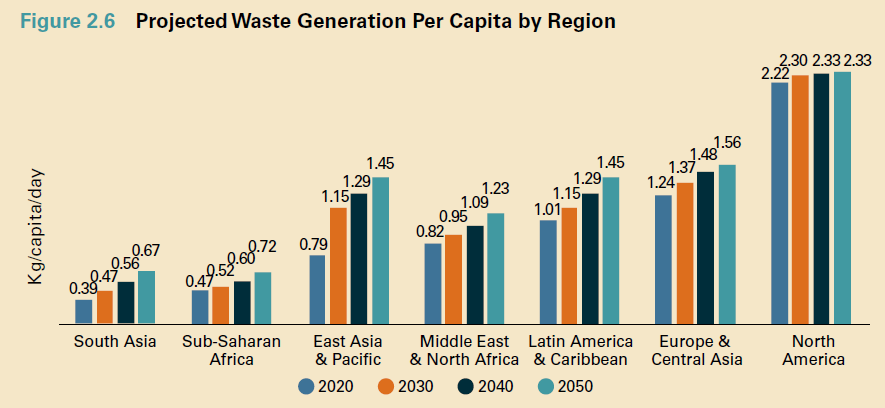
Per capita, North America is estimated to produce more waste, about 2.22 kg per person per day estimated on average in 2020. South Asia and sub-Saharan Africa are regions with large populations but lower per capita rates (0.39 kg and 0.47 kg respectively). These regional disparities are expected to persist in the coming decades, although some regions will experience faster economic growth than others.
Source (1)
Product analysis is essential for the development of localised diversification and recovery strategies. Food and green waste make up more than 50% of waste in low- and middle-income countries. In high-income countries, the amount of organic matter is comparable in absolute terms but, due to higher amounts of packaging waste and other non-organic waste, organic waste accounts for approximately 32%.
Recyclable materials make up a substantial fraction of waste streams, ranging from 16% for paper, cardboard, plastic, metal and glass in low-income countries to about 50% in high-income countries. As income levels rise, the amount of recyclable materials in the waste stream increases, with paper increasing most significantly.
READ ALSO: Textile waste and circular economy: prospects for the future
Key insights
- Uncollected waste and poorly disposed of waste significantly affect public health and the environment, and furthermore have a considerable economic impact over the long term (multiplication of development costs)
- Waste management contributes nearly 5% of global greenhouse gas emissions, mainly driven by food waste and improper management
- Waste management systems should take into account the potential effects of climate change on local conditions - planning and implementing appropriate infrastructure for this (resilience)
- More than 15 million people globally earn a living informally in the waste sector (extremely vulnerable demographic groups).
Strategies for optimal management
The strategies for overcoming complexities and providing support identified are:
- Infrastructure: the need for capital investment to build or upgrade facilities, reclaim landfills, build or restructure landfills and collection systems.
- Legal and institutional structures: developing coordinated institutional policy measures for the sector
- Financial sustainability: design of tax and fee structures and long-term planning
- Citizen involvement: designing incentives and awareness-raising systems to encourage waste reduction, separation at source and reuse
- Social inclusion: strategies such as integration into the formal system, as well as the provision of safe working conditions, social safety nets, restrictions on child labour and education
- Climate change and the environment: support for projects to decrease the production of greenhouse gases through waste reduction, organic waste diversion and the adoption of appropriate treatment and disposal technologies. As well as safeguarding infrastructure from local climate effects such as flooding
- Health and safety: improving public health and livelihoods by reducing uncontrolled burning and mitigating the spread of pests and diseases due to uncontrolled dumping
Creating knowledge: planning and exploring locally appropriate solutions through the local development of technical skills, data and analysis.
Sources:
(1) “Kaza, Silpa; Shrikanth, Siddarth; Chaudhary, Sarur. 2021. More Growth, Less Garbage. Urban Development Series. World Bank, Washington, DC. © World Bank.
License: CC BY 3.0 IGO.”
(2) “Kaza, Silpa; Yao, Lisa C.; Bhada-Tata, Perinaz; Van Woerden, Frank. 2018. What a Waste 2.0 : A Global Snapshot of Solid Waste Management to 2050. Urban Development;. Washington, DC: World Bank. © World Bank.
License: CC BY 3.0 IGO.”